
Introduction
Market Profile serves as an essential visualisation tool rooted in Auction Market Theory, helping traders quickly assess market structure and participant behaviour. It organises price activity to highlight areas of agreement and rejection, making it a valuable aid rather than a standalone system. Many combine it with price action and order flow for confluence.
Recommended reading includes foundational books on the subject, such as works by Steidlmayer, Dalton, and Keppler, along with official CBOT guides.
The “80% Rule” in futures trading, which suggests that if the price re-enters and holds within the previous session’s value area, there is an 80% probability it will travel the full range of that value area.
Historical Background
Developed in the early 1980s by Peter Steidlmayer at the Chicago Board of Trade, this approach aimed to provide greater transparency for non-floor traders and boost market participation. It applied bell curve statistics to session data, facing initial resistance but eventually becoming a standard educational topic.
Types of Market Participants
Traders fall into short-timeframe (scalpers and day traders with limited horizons) and long-timeframe categories (institutional players building positions over extended periods). The former often revolve around fair value zones, while the latter drive directional moves.
Core Concept: Time Price Opportunity (TPO)
The foundation lies in TPO charts, where each letter represents a fixed interval (typically 30 minutes) during which price interacts with a level. Profiles build horizontally, forming distributions that reveal time-based acceptance.
Initial Balance and Specific Features
The Initial Balance covers the range established in the first hour (or two periods). Narrow setups hint at trends; wide ones suggest ranges. Additional elements include failed auctions (unsustained breaks), excess (tails indicating rejection), poor highs/lows (low-conviction extremes likely to be retested), single prints (gaps often filled), and ledges (rejected zones acting as support/resistance).
Day Types and Shapes
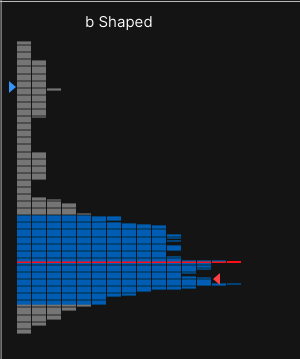
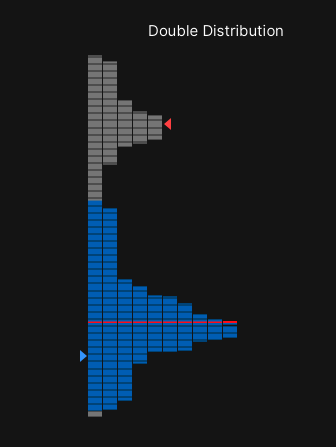
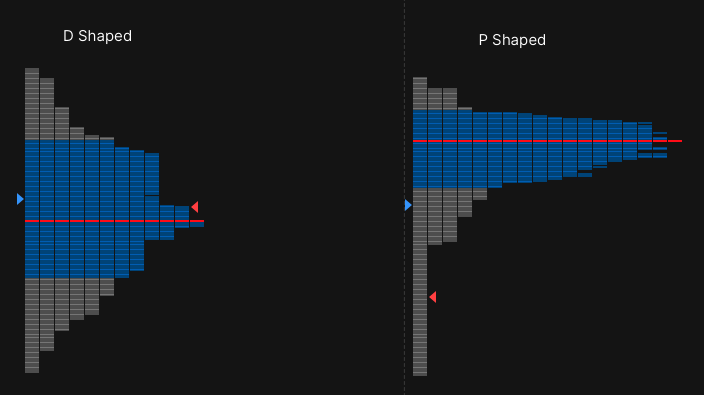
Sessions classify as non-trend (normal or neutral variations) or trending. Non-Trending often resemble “D” shaped profile. Trending includes pure trend days (persistent direction with single prints), double distributions (separate value zones), and shaped profiles like “b” (early sell-off followed by balance) or “p” (early rally then distribution).
Opening Types
Early session behavior provides clues: drive (strong momentum from open), test drive (probing key levels first), rejection reverse (failed probe leading to opposite move), or in-range auction (balanced open).
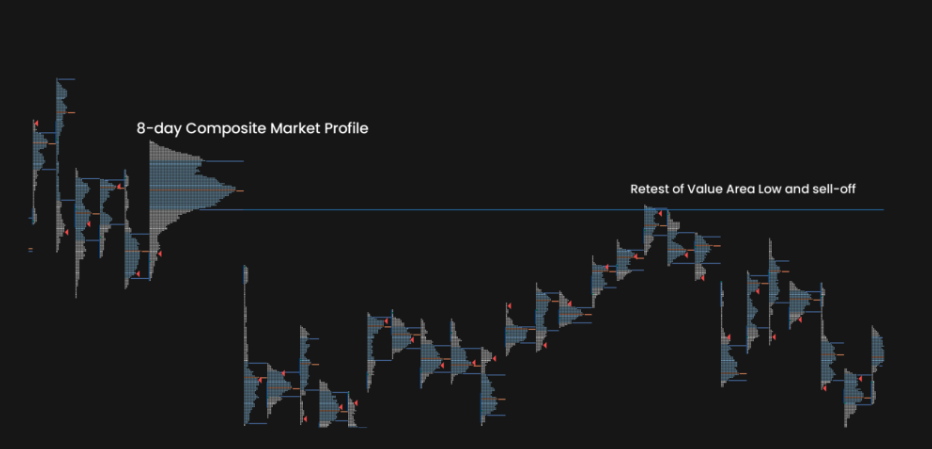
Building Composites
Longer-term views merge multiple sessions, especially overlapping value areas, to identify broader control points and evolving structure.
Practical Rules and Applications
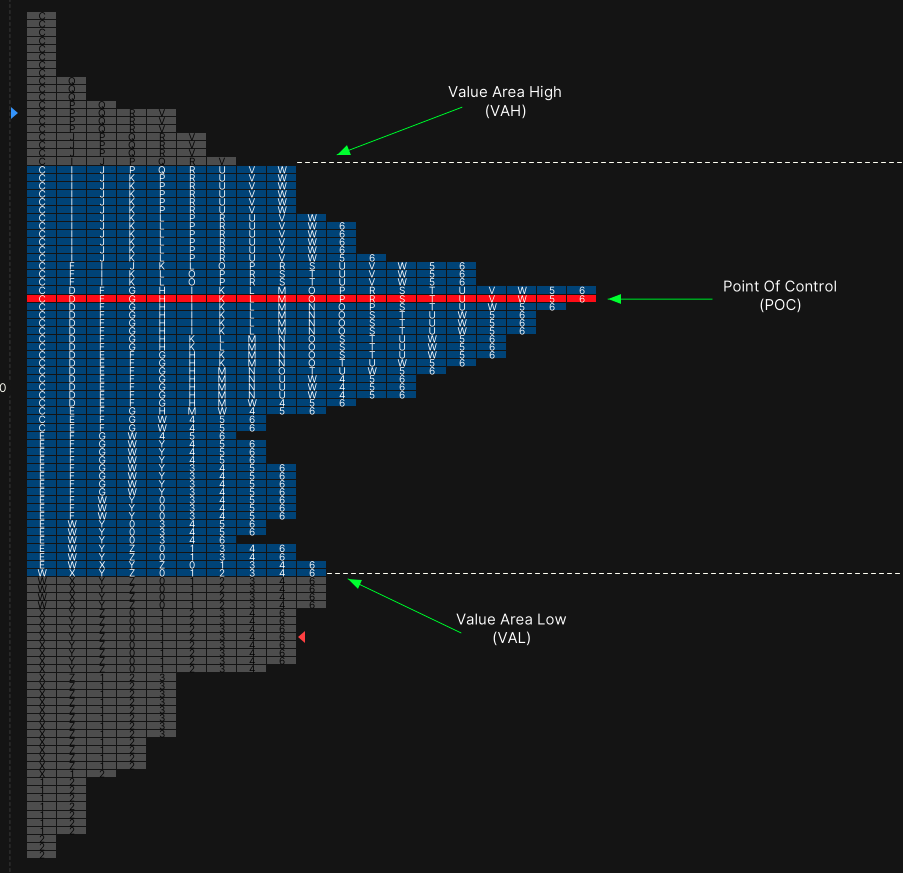
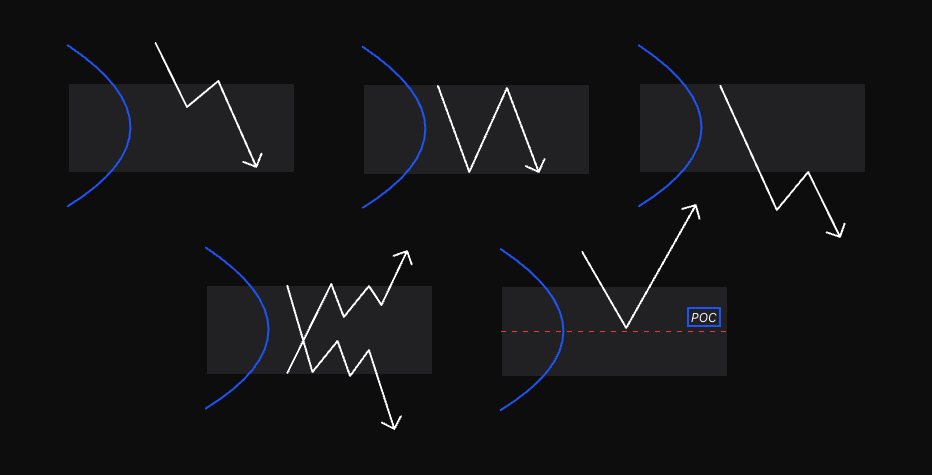
The examples below show applications for trading market profile. Looking at the key Value Areas and POC to establish a context for potential trading setups. Often when price breaks back into prior value it will travers the range, this is also applicable when a failed auction occurs. If price breaks out of balance with momentum, there is often a retest of value, before continuation of the trend. Apply across futures, forex, stocks, and crypto with appropriate platform tools.
Final Thoughts
Market Profile offers timeless insights into auction dynamics, enhancing daily analysis when understood. Integrate it thoughtfully for clearer views of balance and imbalance in any market environment. Looking at key pivot areas for potential trades, when breaking out or back into fair-value.
Leave a Reply