
Getting Started with Footprint Charts
Footprint charts represent a sophisticated tool in order flow analysis, offering traders a detailed breakdown of activity within each price bar. While traditional candlestick charts only show open, high, low, and close with wicks that obscure specifics, footprint charts reveal the exact volume executed at every price increment inside the bar. This transparency helps identify aggressive buying or selling, absorption by limit orders, and potential trapping of participants—insights that remain hidden in standard views.
These charts, popularized in the early 2000s, go by various names like cluster charts or order flow profiles due to branding history. They display completed trades rather than resting orders, making them a real-time, non-lagging resource for understanding market intent.
When to Use Footprint Charts Effectively
Approach these tools with realistic expectations—they enhance understanding but aren’t universal solutions. They shine in highly liquid futures markets where order flow data is reliable, such as major equity indices (e.g., S&P 500 E-mini, Nasdaq, DAX), fixed income products (e.g., Bund, Treasuries), and cryptocurrencies on centralized exchanges.
Avoid them in decentralized spot forex, where aggregated data can distort signals, or in fragmented commodities like oil. For crypto, focus on dominant exchanges for accurate intraday views. Specialized platforms are essential for rendering these charts properly.
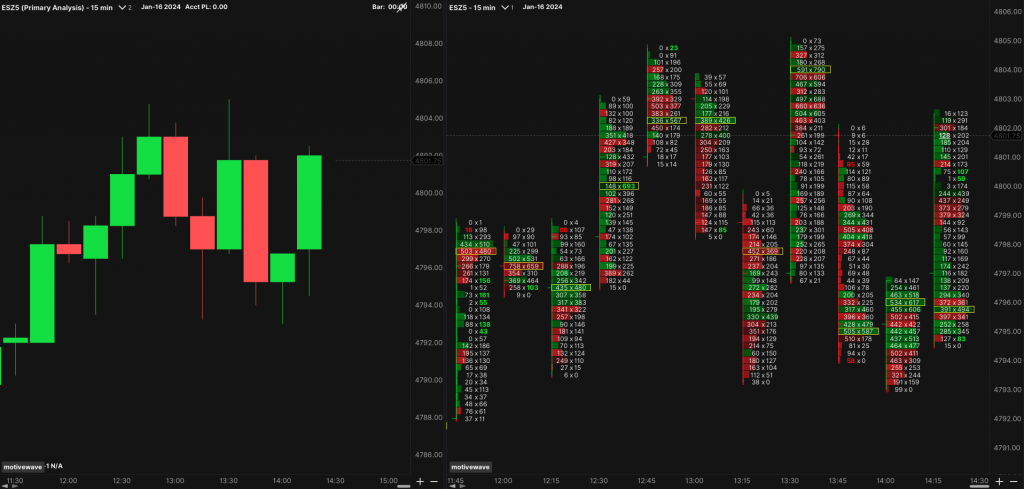
Decoding Footprint Charts
At first glance, these charts can overwhelm, but they quickly become second nature. Each bar breaks down into clusters showing trades at precise level
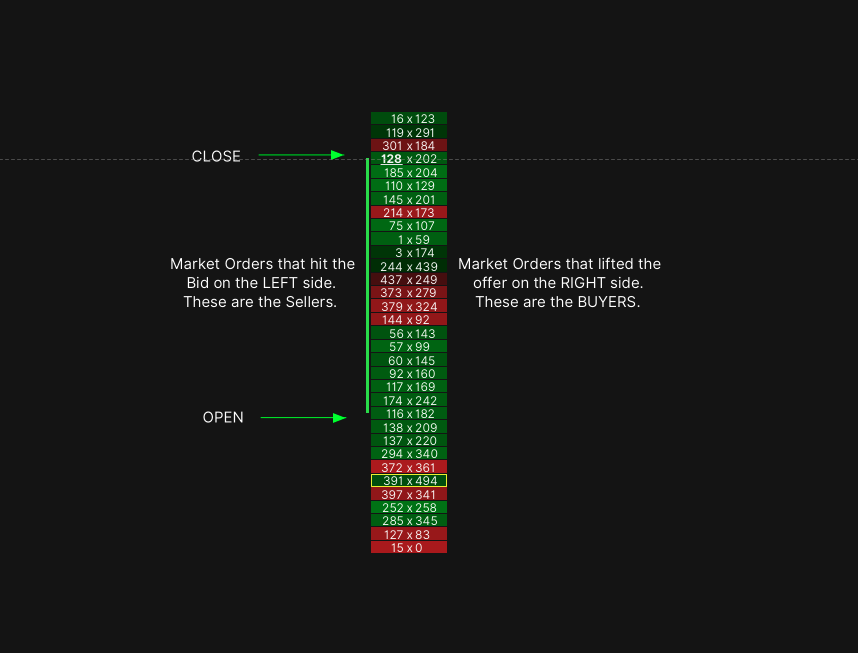
Bid/Ask Variant
The foundational style displays separate figures for trades hitting the bid (aggressive selling) versus lifting the offer (aggressive buying). Typically formatted as bid × ask (e.g., 300 × 500), with left/right alignment indicating direction. Coloring often highlights dominance, aiding quick scans for imbalances.
Delta Variant
This simplifies to a single net figure per level (buying minus selling aggression). Positive values signal buyer control; negative, seller dominance. Useful for spotting absorption where price extends but delta weakens.

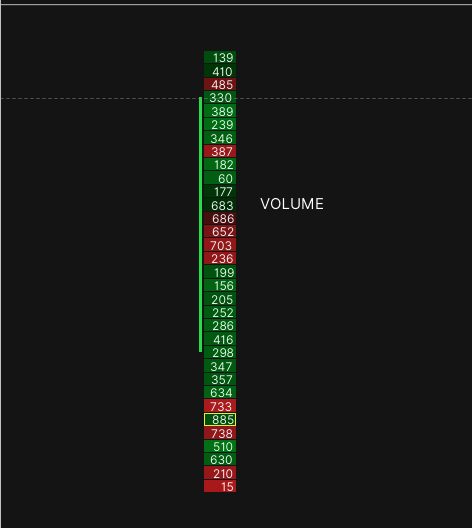
Volume Variant
Focuses purely on total trades per level, ignoring direction. High-volume clusters often act as magnets or barriers, marking areas of significant interest.
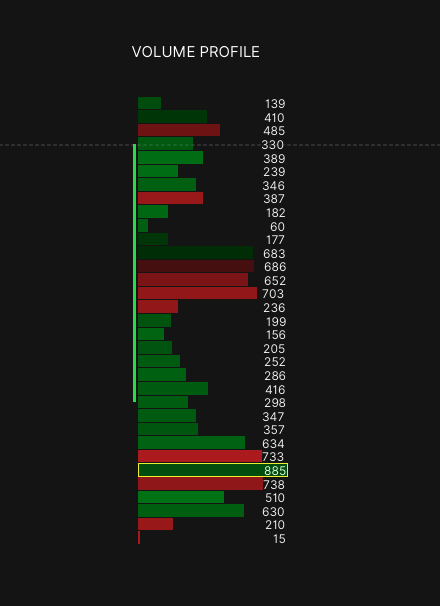
Profile Integration
Combines individual bar clusters with overall volume distribution, revealing nodes of high/low activity and control points for contextual support/resistance.
Choosing Bar Construction Methods
Bars can form based on time (fixed intervals), volume (set contract thresholds), or price movement (tick counts or ranges). Non-time options reduce noise in ranging periods and adapt to activity levels, proving especially valuable for intraday work.
Applications Beyond Day Trading
These tools extend to swing horizons, highlighting reversals through diverging aggression or shifted control points in multi-bar views.
Key Patterns and Setups
Look for diagonal imbalances (stacked dominance signaling potential reversal zones), completed versus incomplete auctions (zero aggression at extremes indicating exhaustion), and volume clusters opposing the trend (suggesting trapping or absorption).
Divergences between price highs/lows and weakening delta often precede pullbacks. Large trade filters can confirm institutional participation.
Final Insights
Footprint charts deliver unparalleled granularity into order flow, best leveraged in suitable markets alongside broader context. With practice, they transform how traders interpret aggression and equilibrium, providing a meaningful advantage in competitive environments. Experiment responsibly to integrate them into your approach.
Leave a Reply